

Dashboards
The figures you watch, on one screen.
Sales by week, bookings by stylist, money in and out: a dashboard that opens straight into cards with the totals and charts.
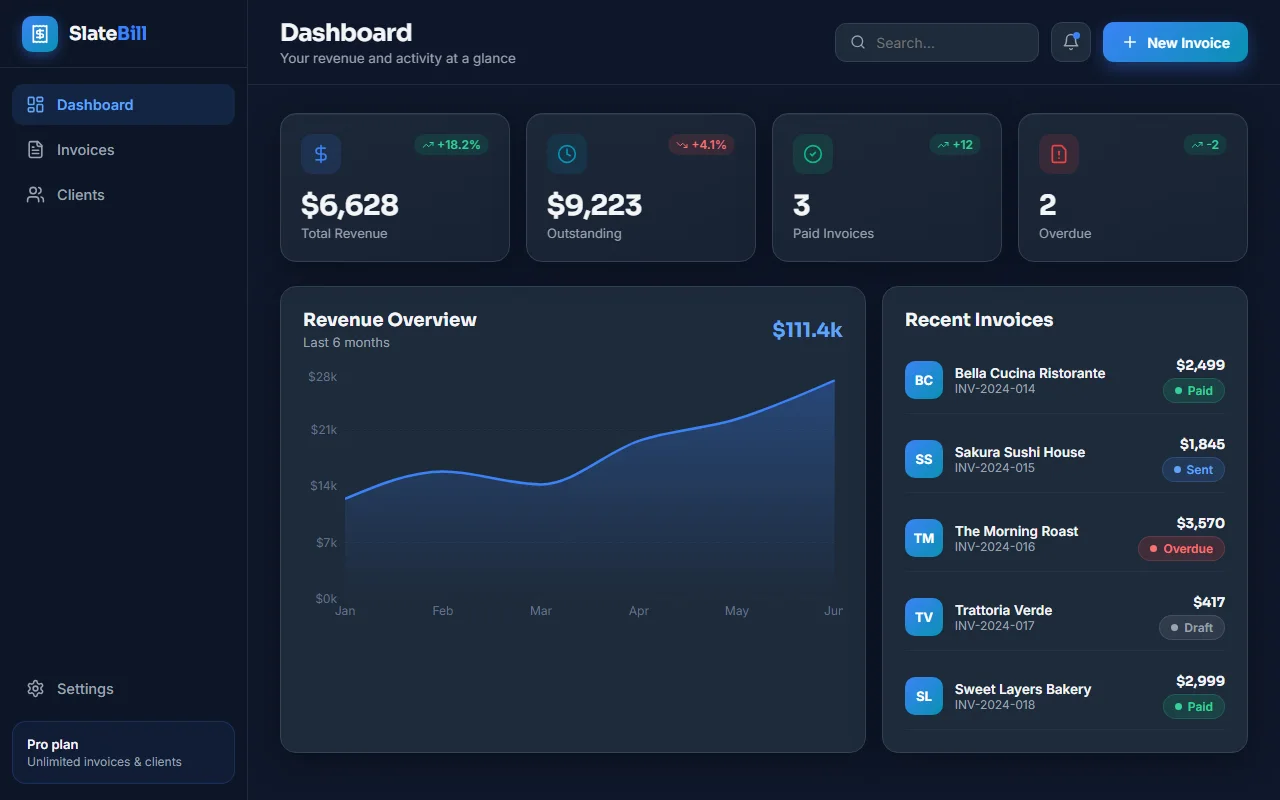
What a dashboard has from the start.
Numbers you watch every day
Numbers you watch every day: sales by week, bookings by stylist, money in and out.
Cards and charts
It opens straight into the screens, with a menu down the side, cards with the totals and charts.
Your own numbers
To fill it with numbers you already keep elsewhere, connect Google Sheets, Airtable or Notion, and ask for the dashboard to read from it.
Sample data from the first second
So you see the tool working before anyone has typed anything into it.
Works on phones
A layout for phones as well as computers.
Real accounts
Sign in with Google, or with an email and a password, from the foot of the menu. Signed out, the screens show the sample data. Signed in, each person sees only their own, with an empty state and an Add button until there is something to show.
Connect the sheet it reads from.
Connecting a service does not put it in every app. In the app, open +, then Connectors, tick the ones this app may use, and press Done. Anything you leave off stays out of the app's code and its keys.
Connectors, in the documentation


Ask like this.
Pick Web App and say what the dashboard shows.
- A dashboard for a small café: sales per day and per product, the busiest hours, and this month compared with last month
- An invoicing app for a freelancer: clients, invoices with items and VAT, paid and unpaid, and a dashboard of what came in each month
- A SaaS for personal trainers to plan their clients' workouts: a home page with three plans, sign-up with Google, and a dashboard of clients and sessions
- A booking app for a hair salon: the stylists, their services and prices, a calendar of appointments by day, and a list of clients with their history